INFOGRAPHICS • INFOGRAPHICS • INFOGRAPHICS •
MAP OF AGRO INNOVATION ECOSYSTEMS IN BRAZIL
MAP OF AGRO INNOVATION ECOSYSTEMS IN BRAZIL
2019
•
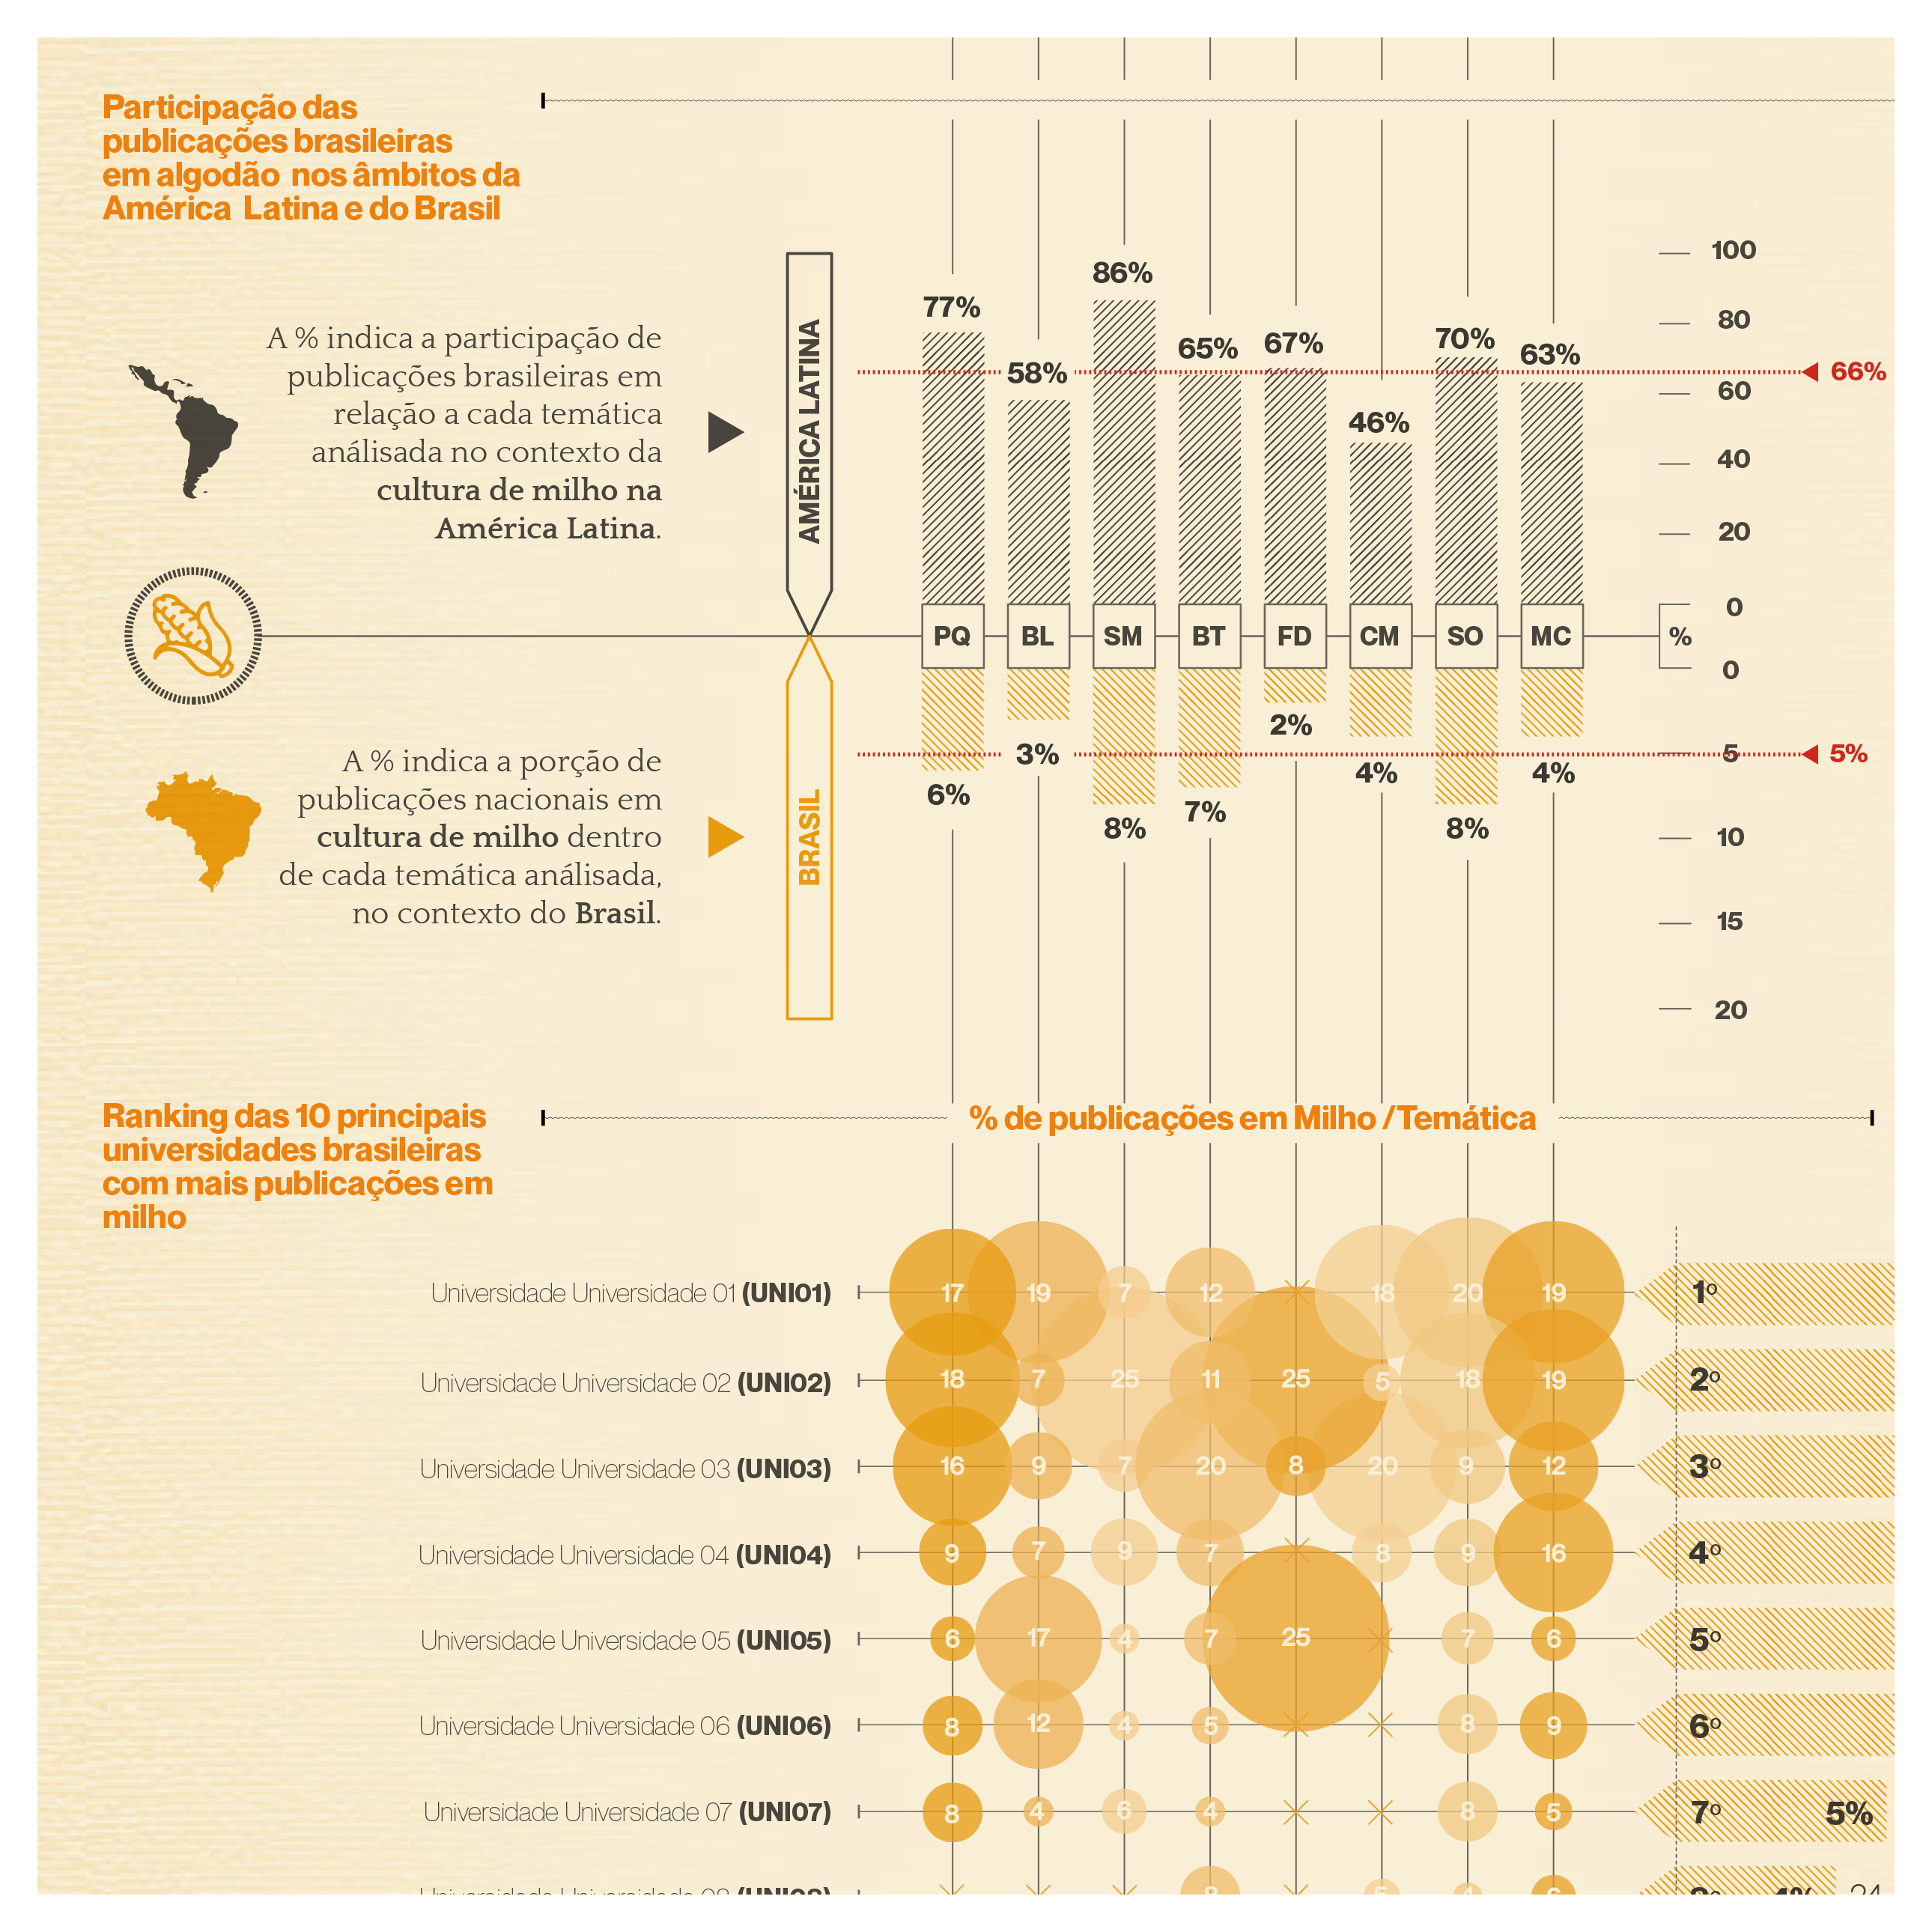
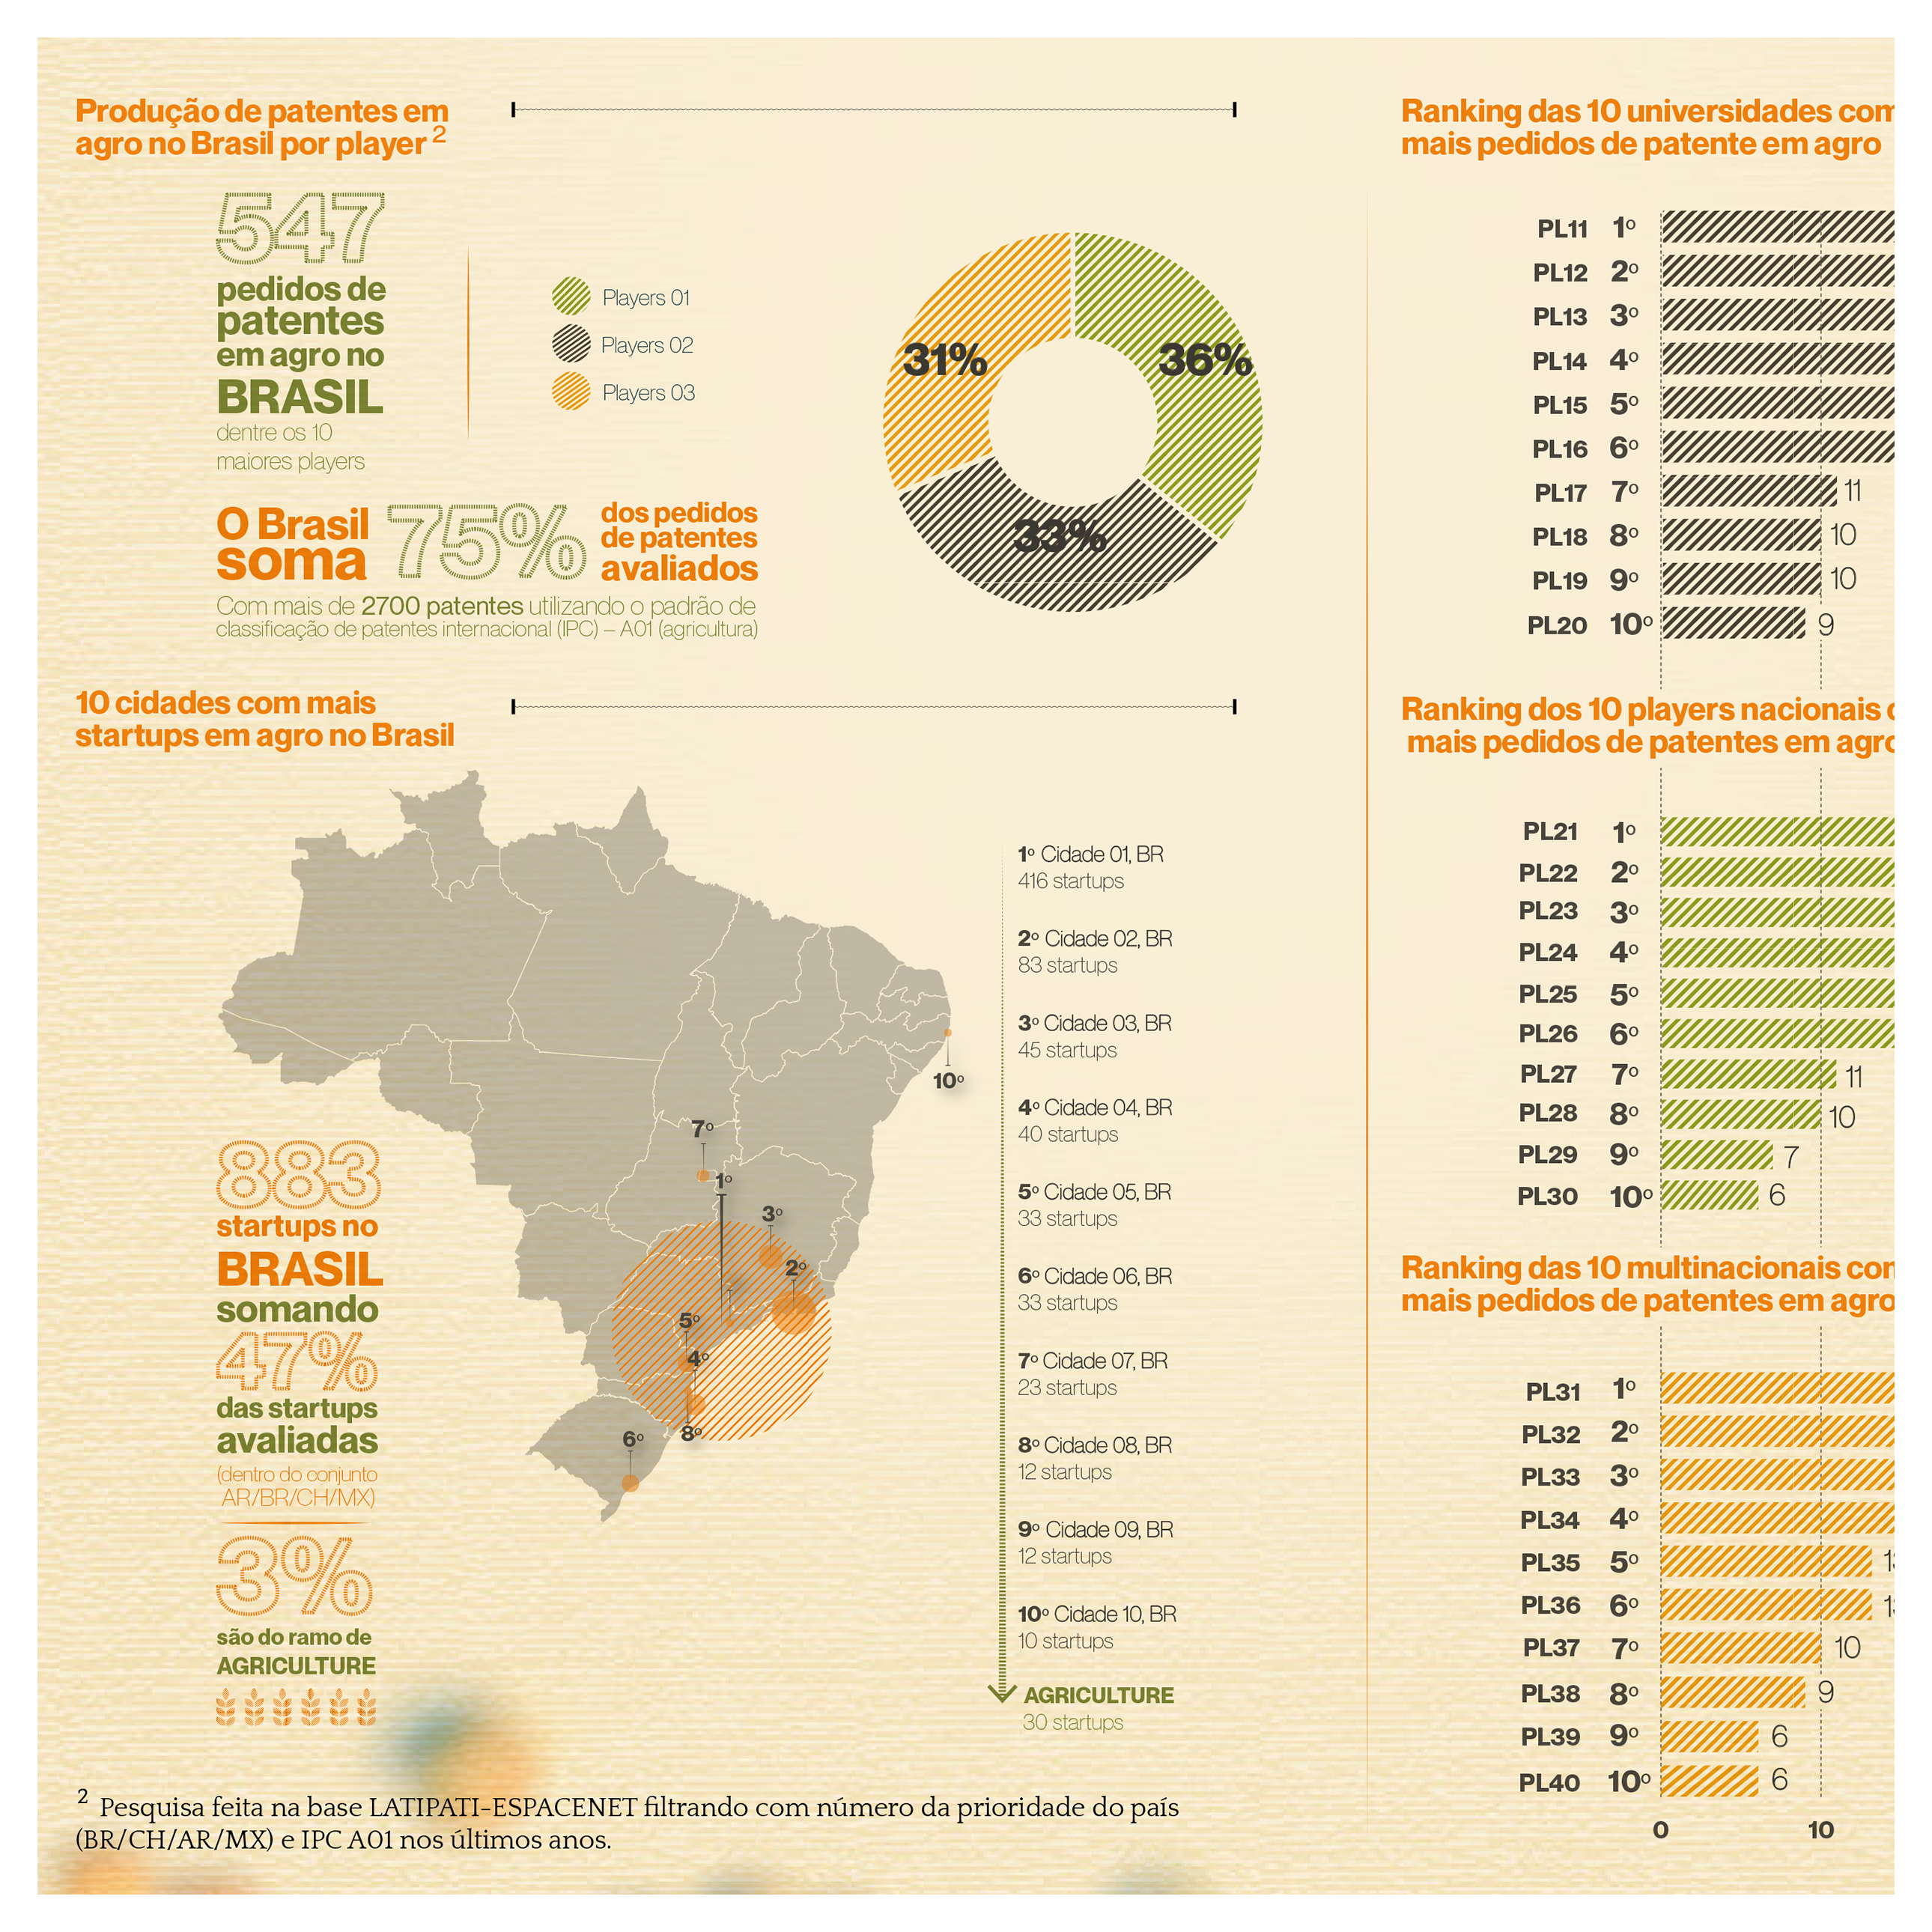
Made for a multinational company in the agribusiness sector, this dashboard summarizes the mapping of the innovation ecosystem in the agricultural sector in Brazil and Latin America. It surveyed the universities that most publish scientific articles on the subject, where the cities with the most startups are located, the main national players and the number of registered patents, all according to the type of cultivation and technologies applied in the field. With a series of 4 dashboards, the set analyzes the ecosystems of 4 Latin American countries: Argentina, Brazil, Chile and Mexico and establishes comparisons between countries in order to facilitate the company's investment decision-making in these areas.
CHECK OUT FOR MORE DETAILS HERE ︎︎︎
︎︎︎


PUBLIC POLICIES FOR THE LGBTQIA+ POPULATION
2018
•
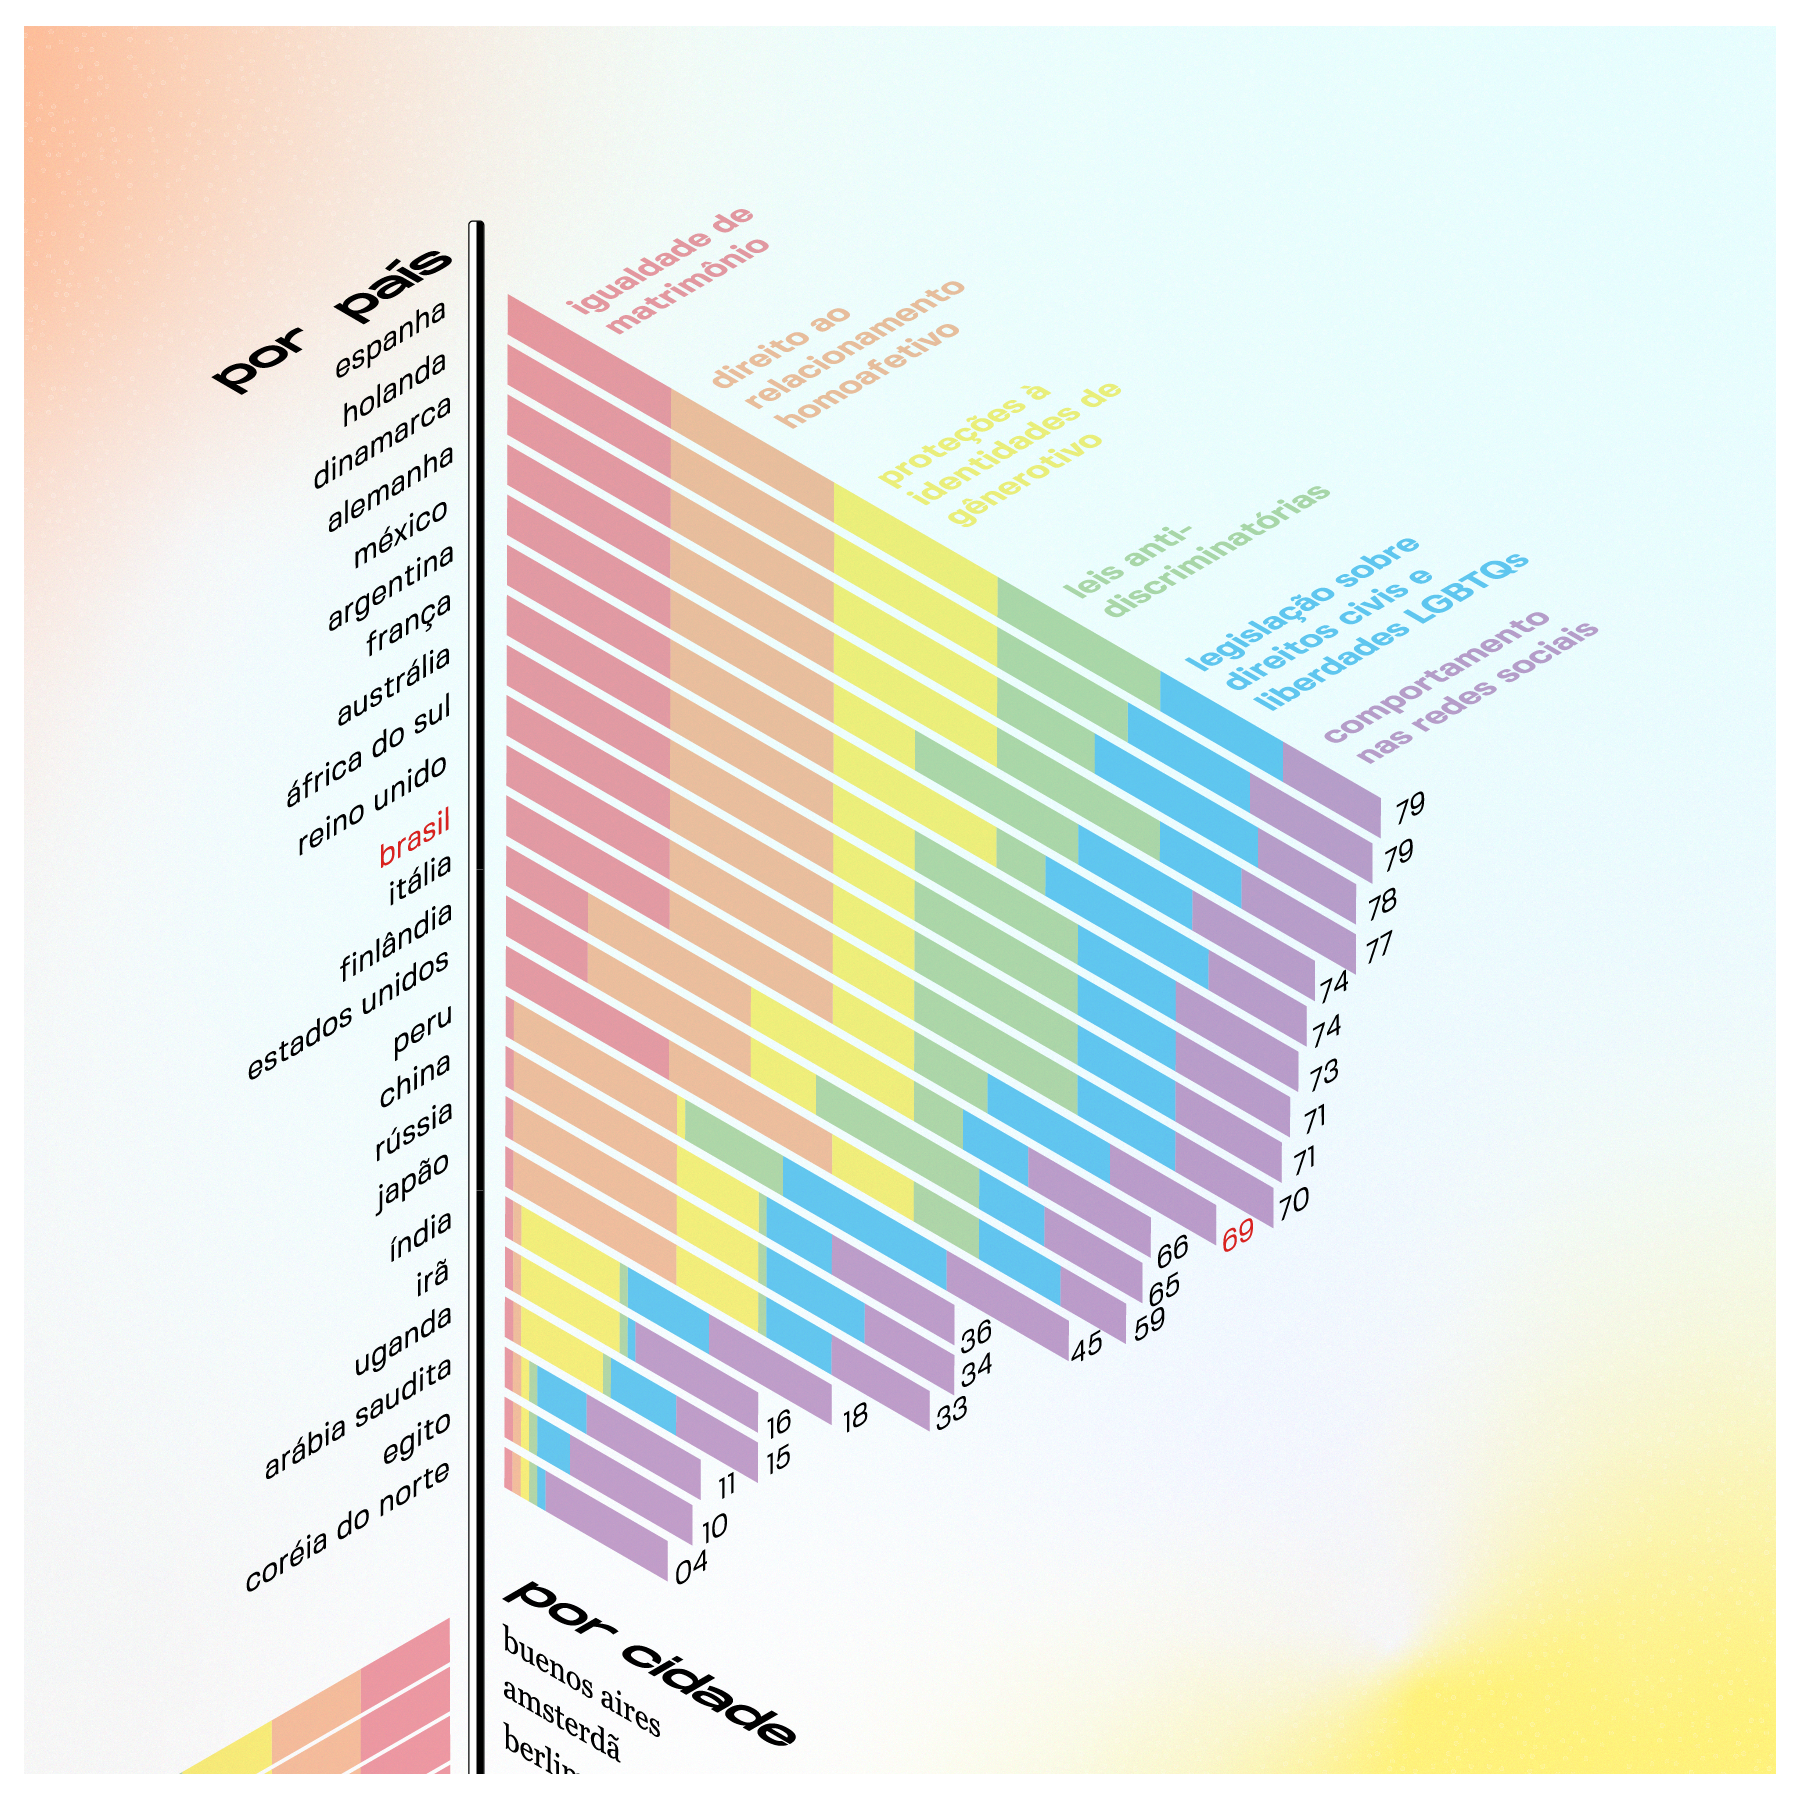
This infographic analyzes the status of 6 main rights and guarantees for the LGBTQIA+ population in the world (marital equality, the right to same-sex relationships, gender identity protections, anti-discrimination laws, legislation on civil rights and LGBTQIA+ freedoms, behavior on social media social), ranking some countries and cities according to the implementation level of these guarantees at the level of public policies. The datas were based on the data of “Destination Pride” platform.
CHECK OUT FOR MORE DETAILS HERE ︎︎︎
︎︎︎


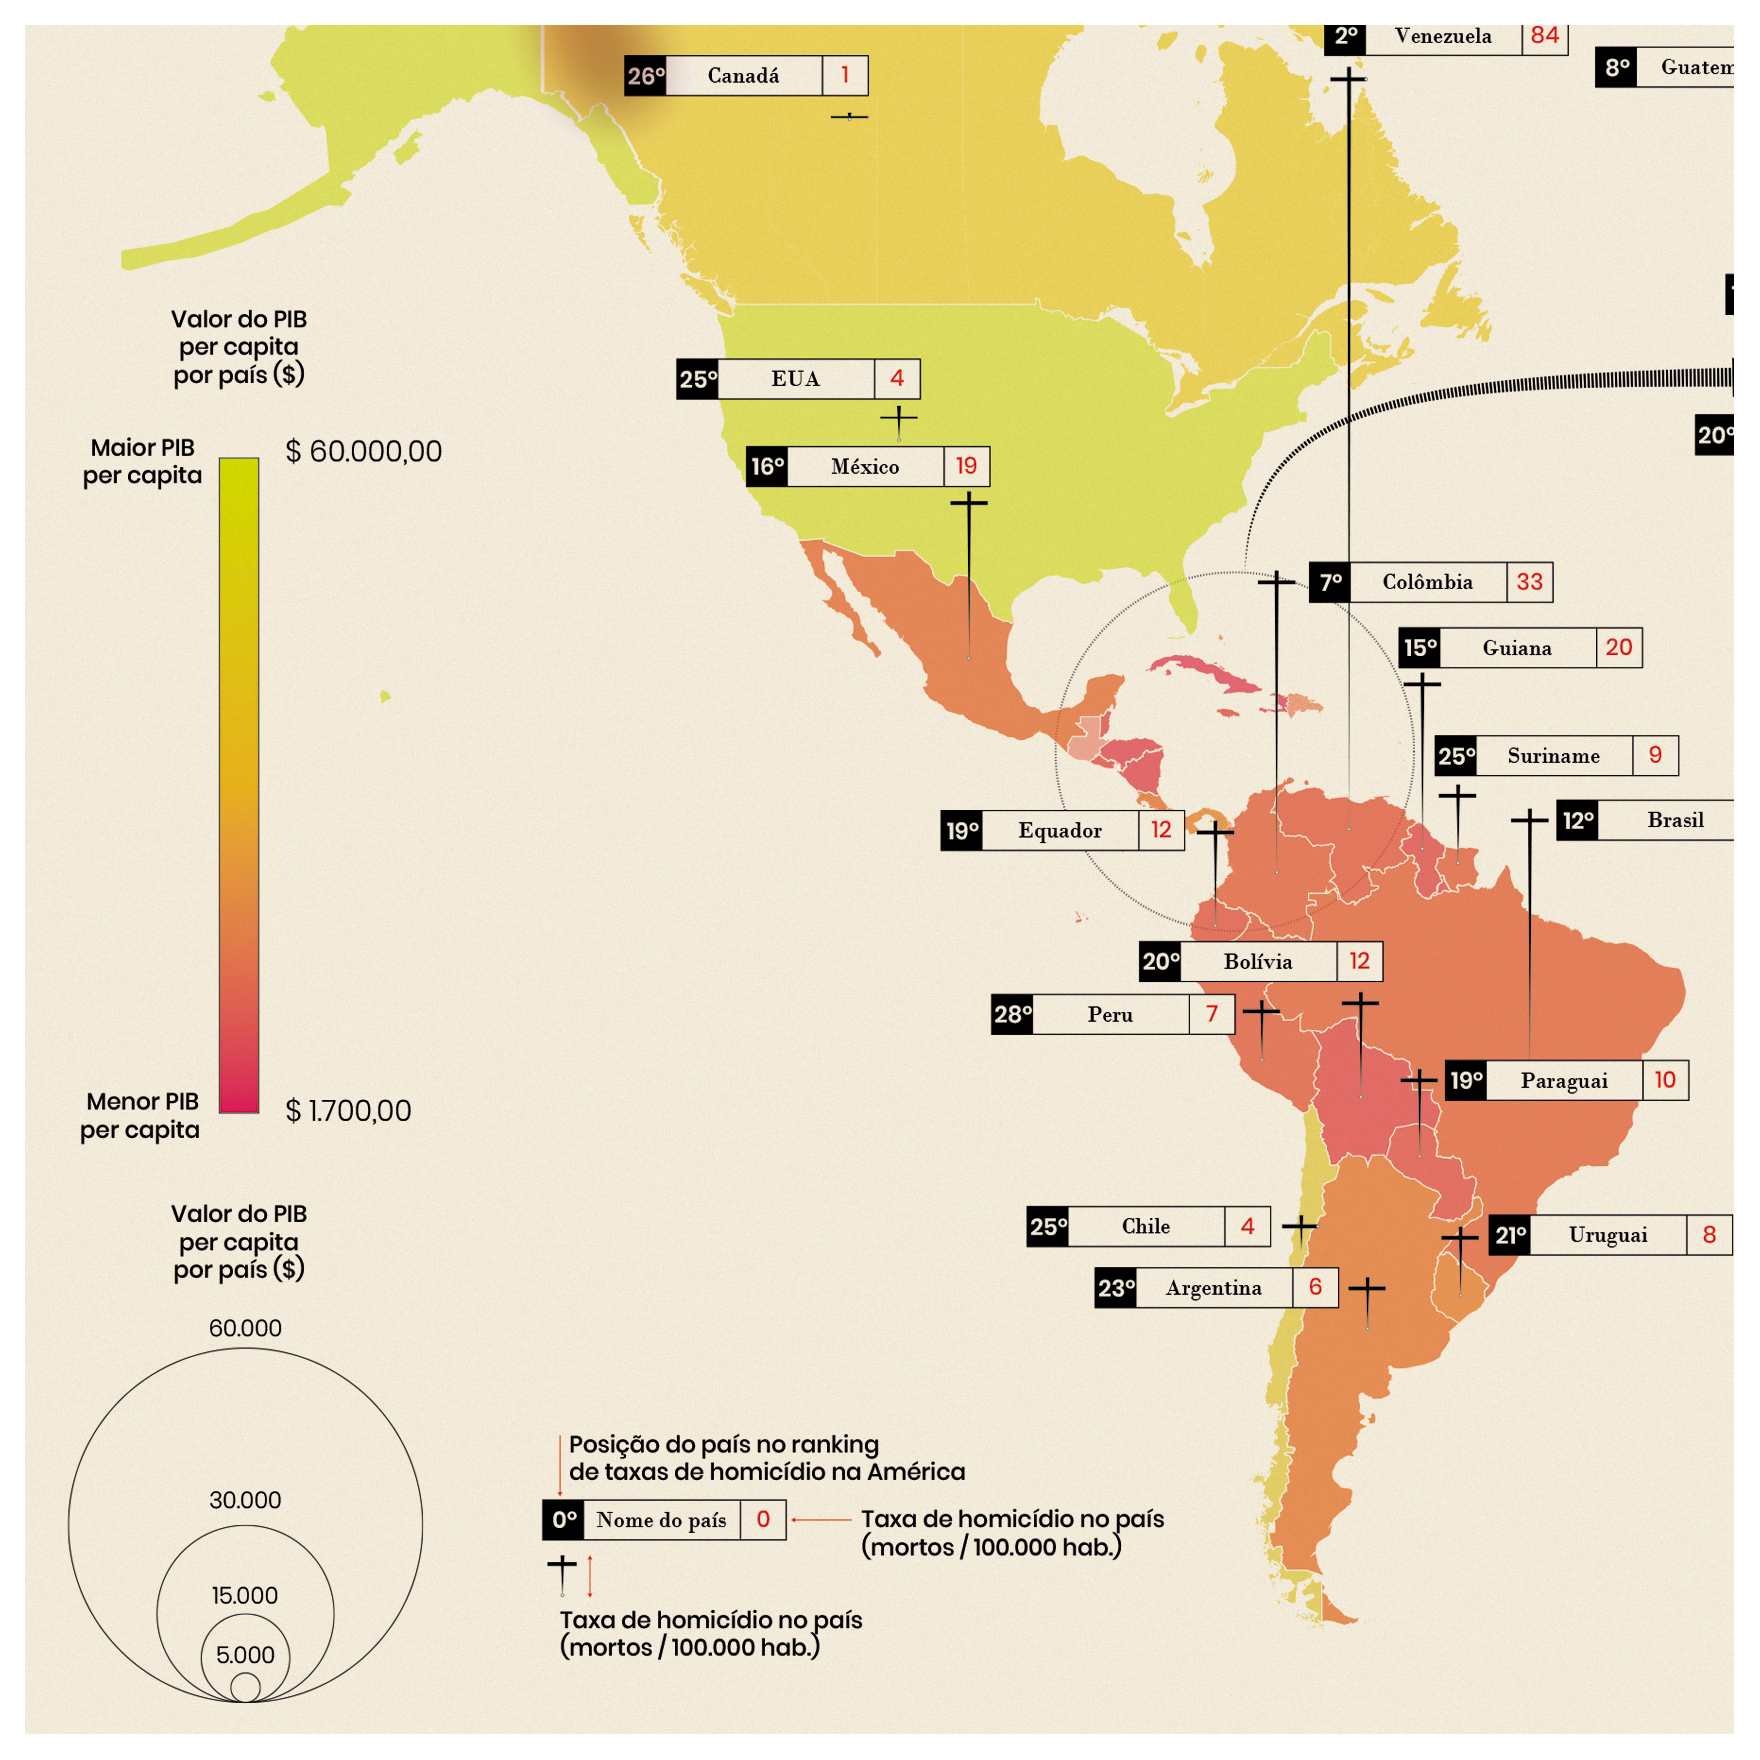
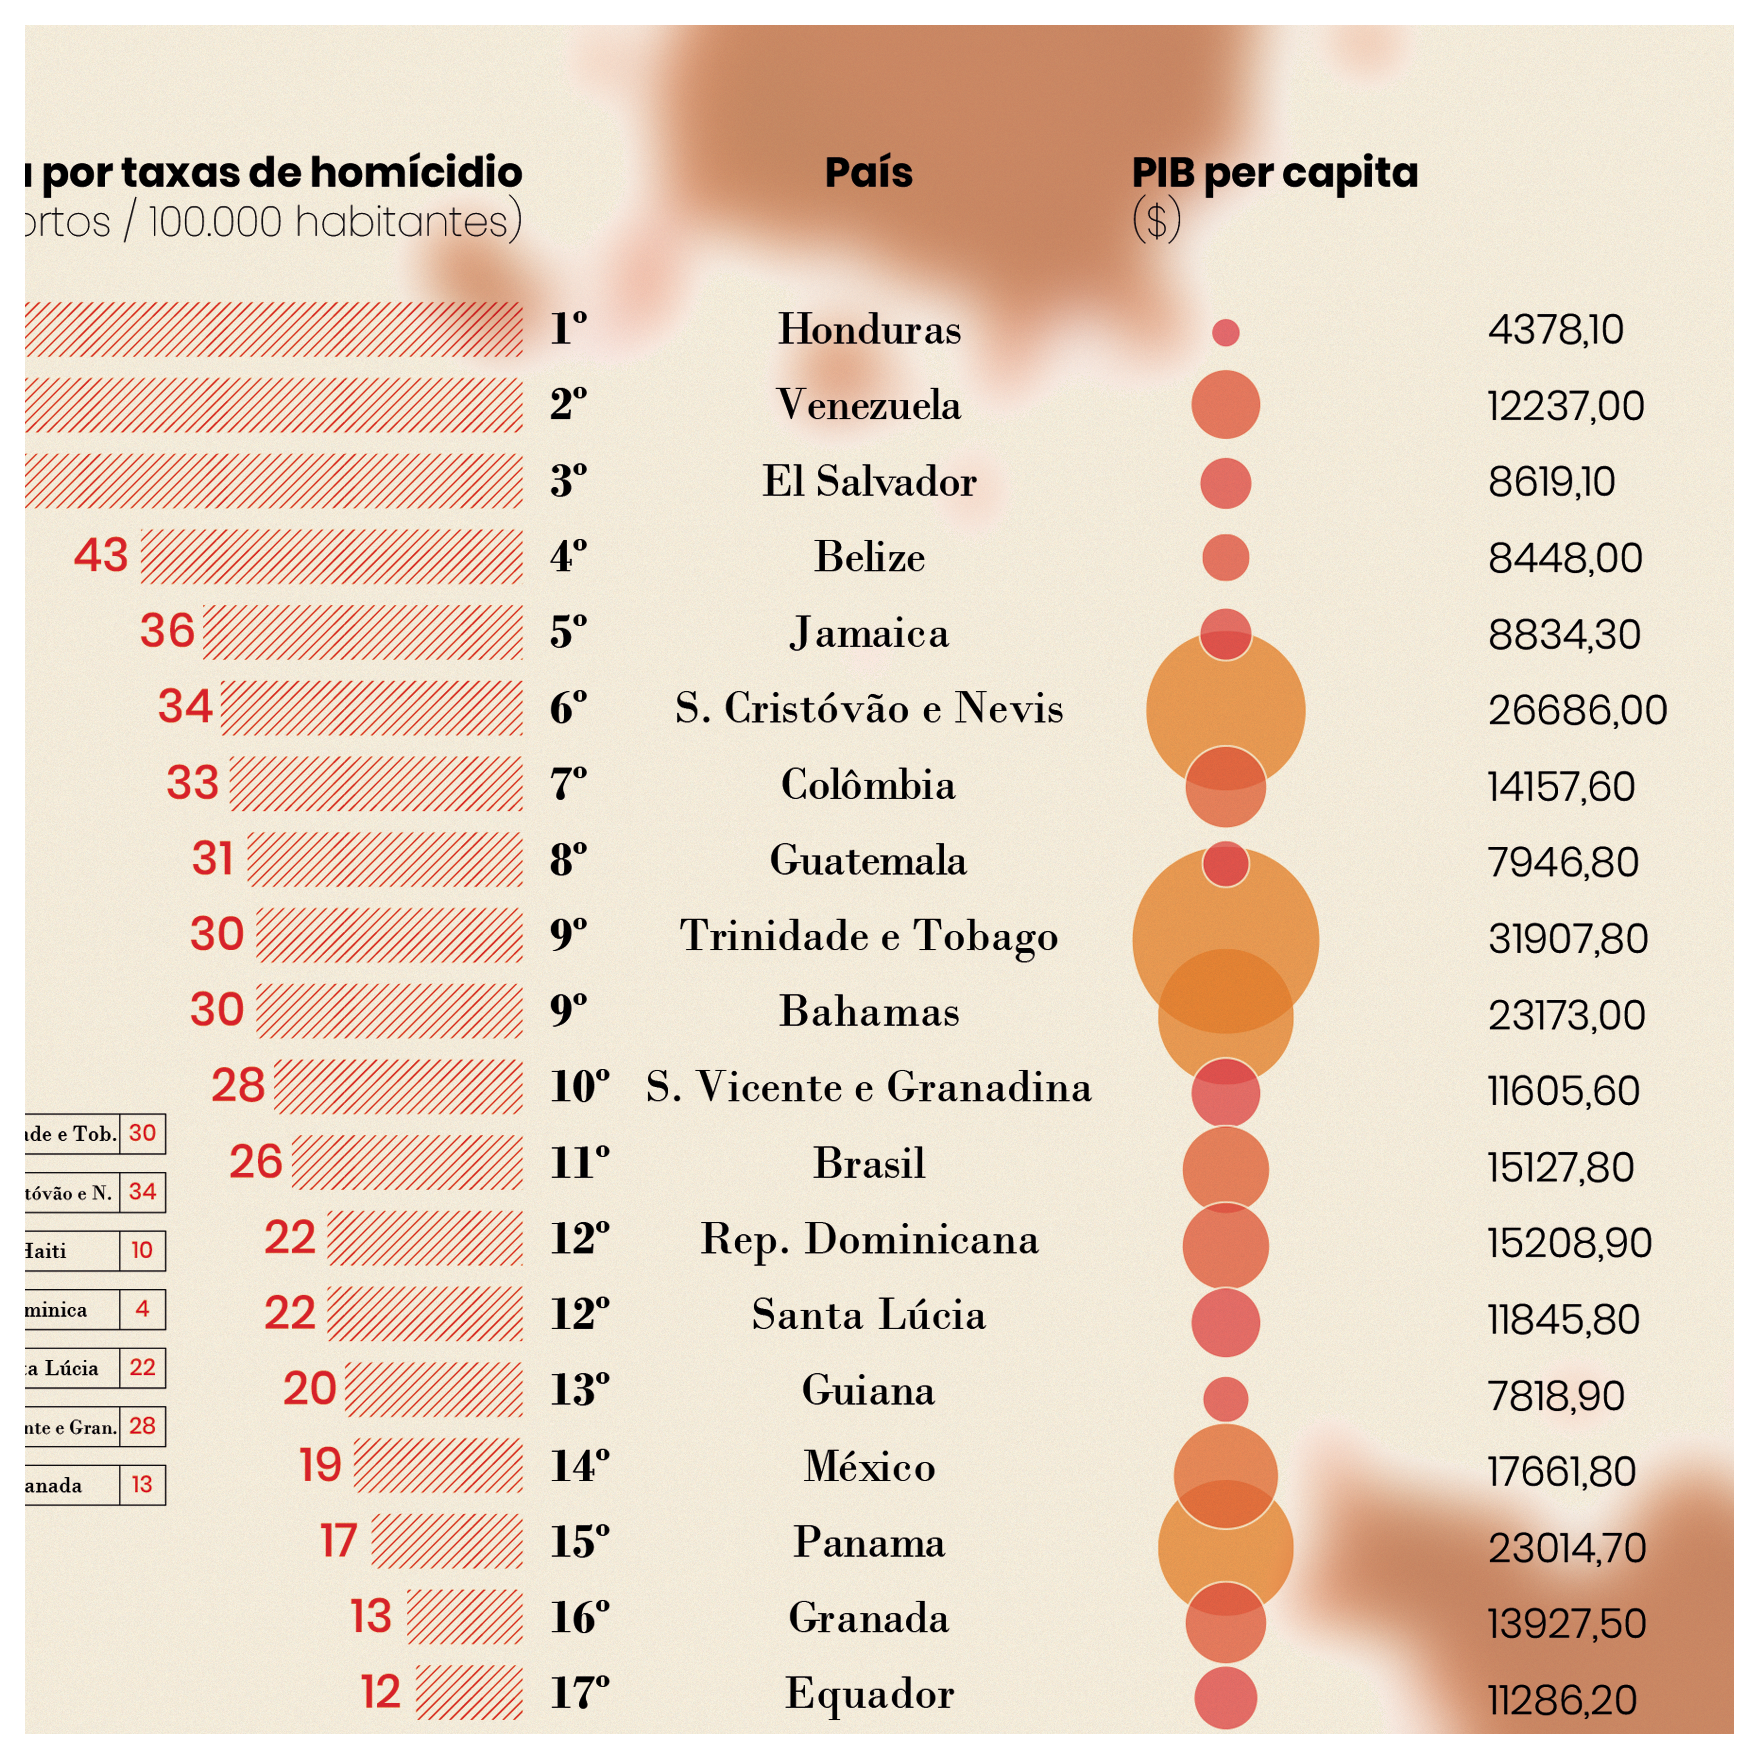
HOMICIDE RATES IN AMERICA AND THEIR RELATIONSHIP TO PER CAPITA GDP
2020
•
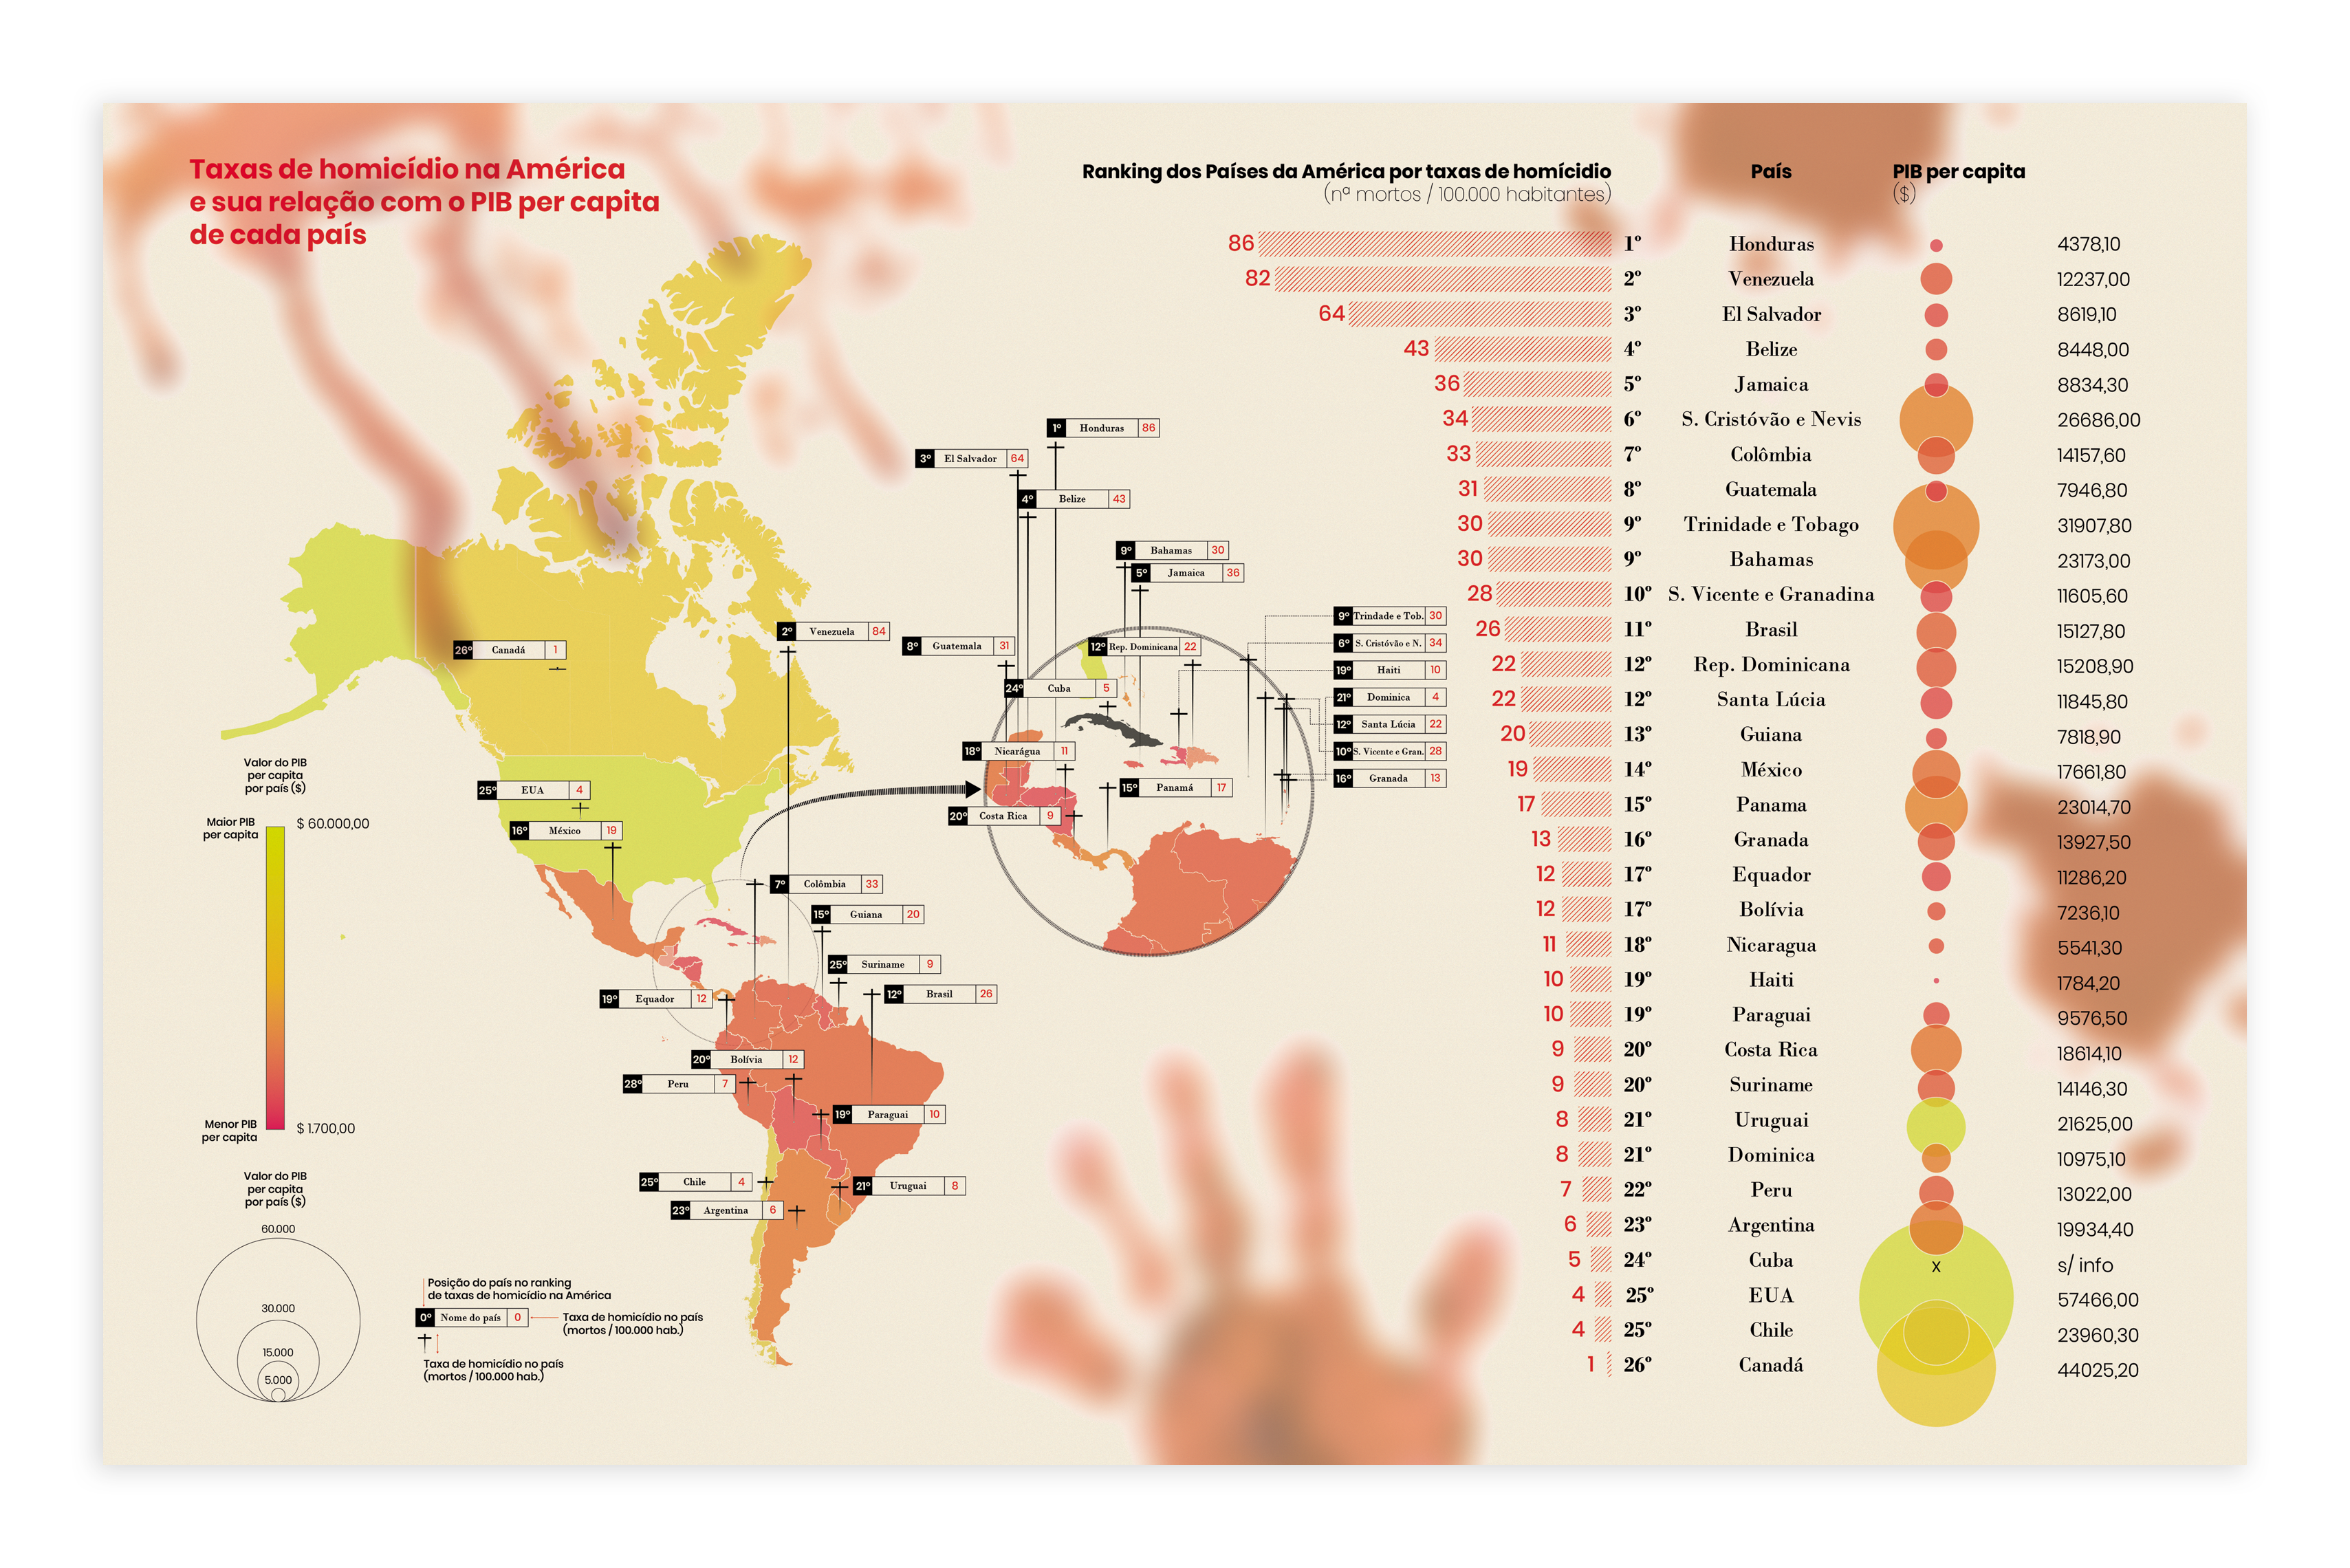
The map shows the homicide rate of the countries of the American continent and its relation with the GDP per capita of each country. The crossing of the two data makes it possible to create a ranking of the most violent nations in America and establish a cause-effect correlation between violence and poverty in these countries.
CHECK OUT FOR MORE DETAILS HERE ︎︎︎
︎︎︎

WHO WERE THE TITANIC'S DEAD?
2020
•
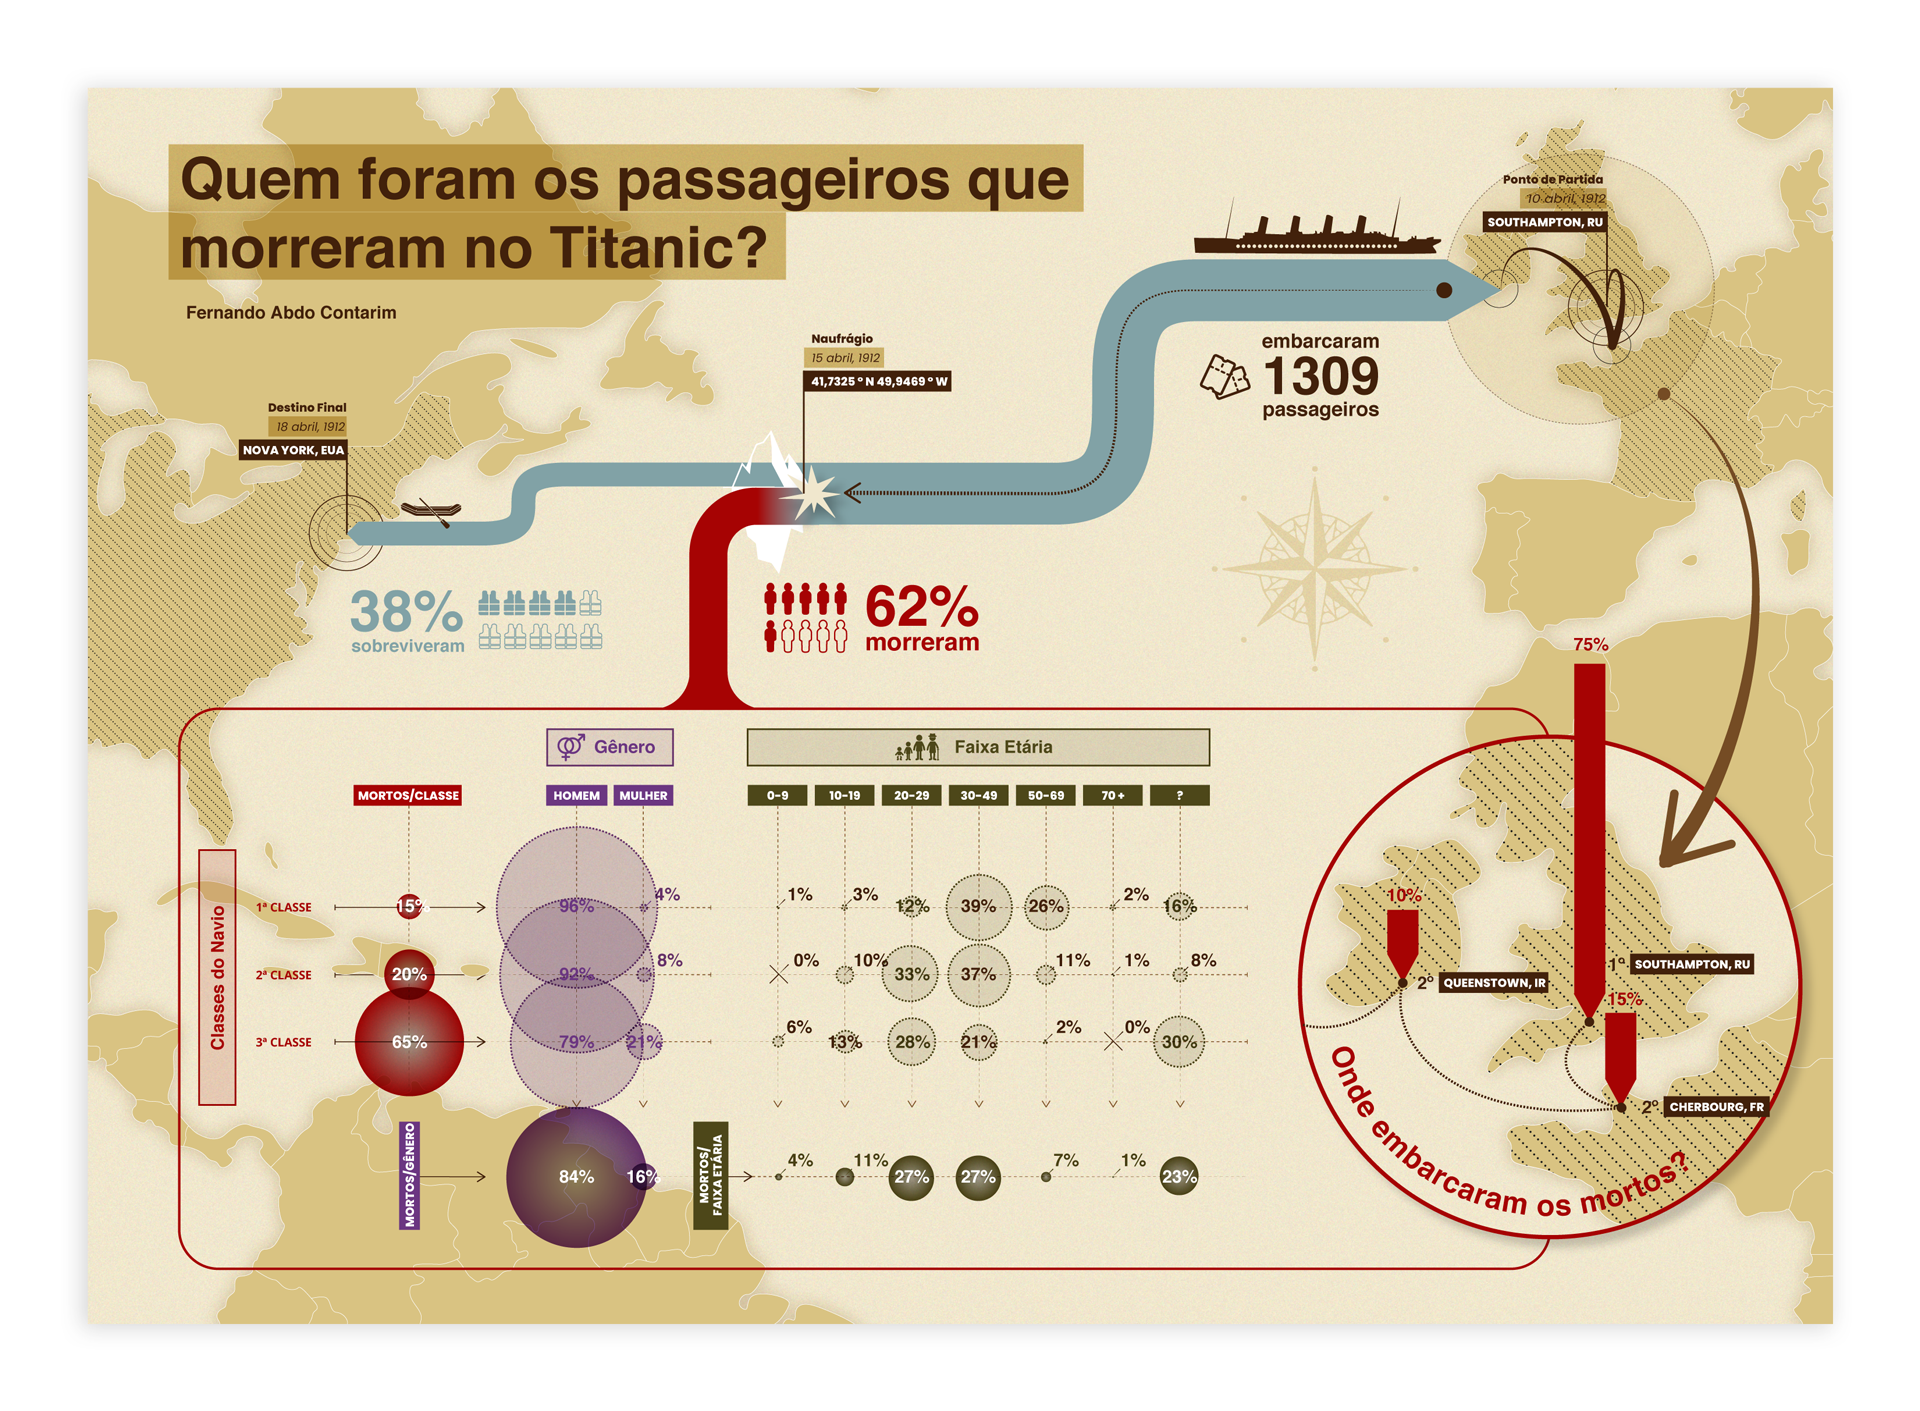
This infographic surveys the profile of those killed in the sinking of the ocean liner Titanic in 1912, providing information such as gender, age group and class of passengers killed, as well as a tracking of boarding places and the number of survivors who reached the final destination of the trip, in New York City.
︎︎︎


ARCHITETURAL DIAGRAMAS
2015 - 2018
•
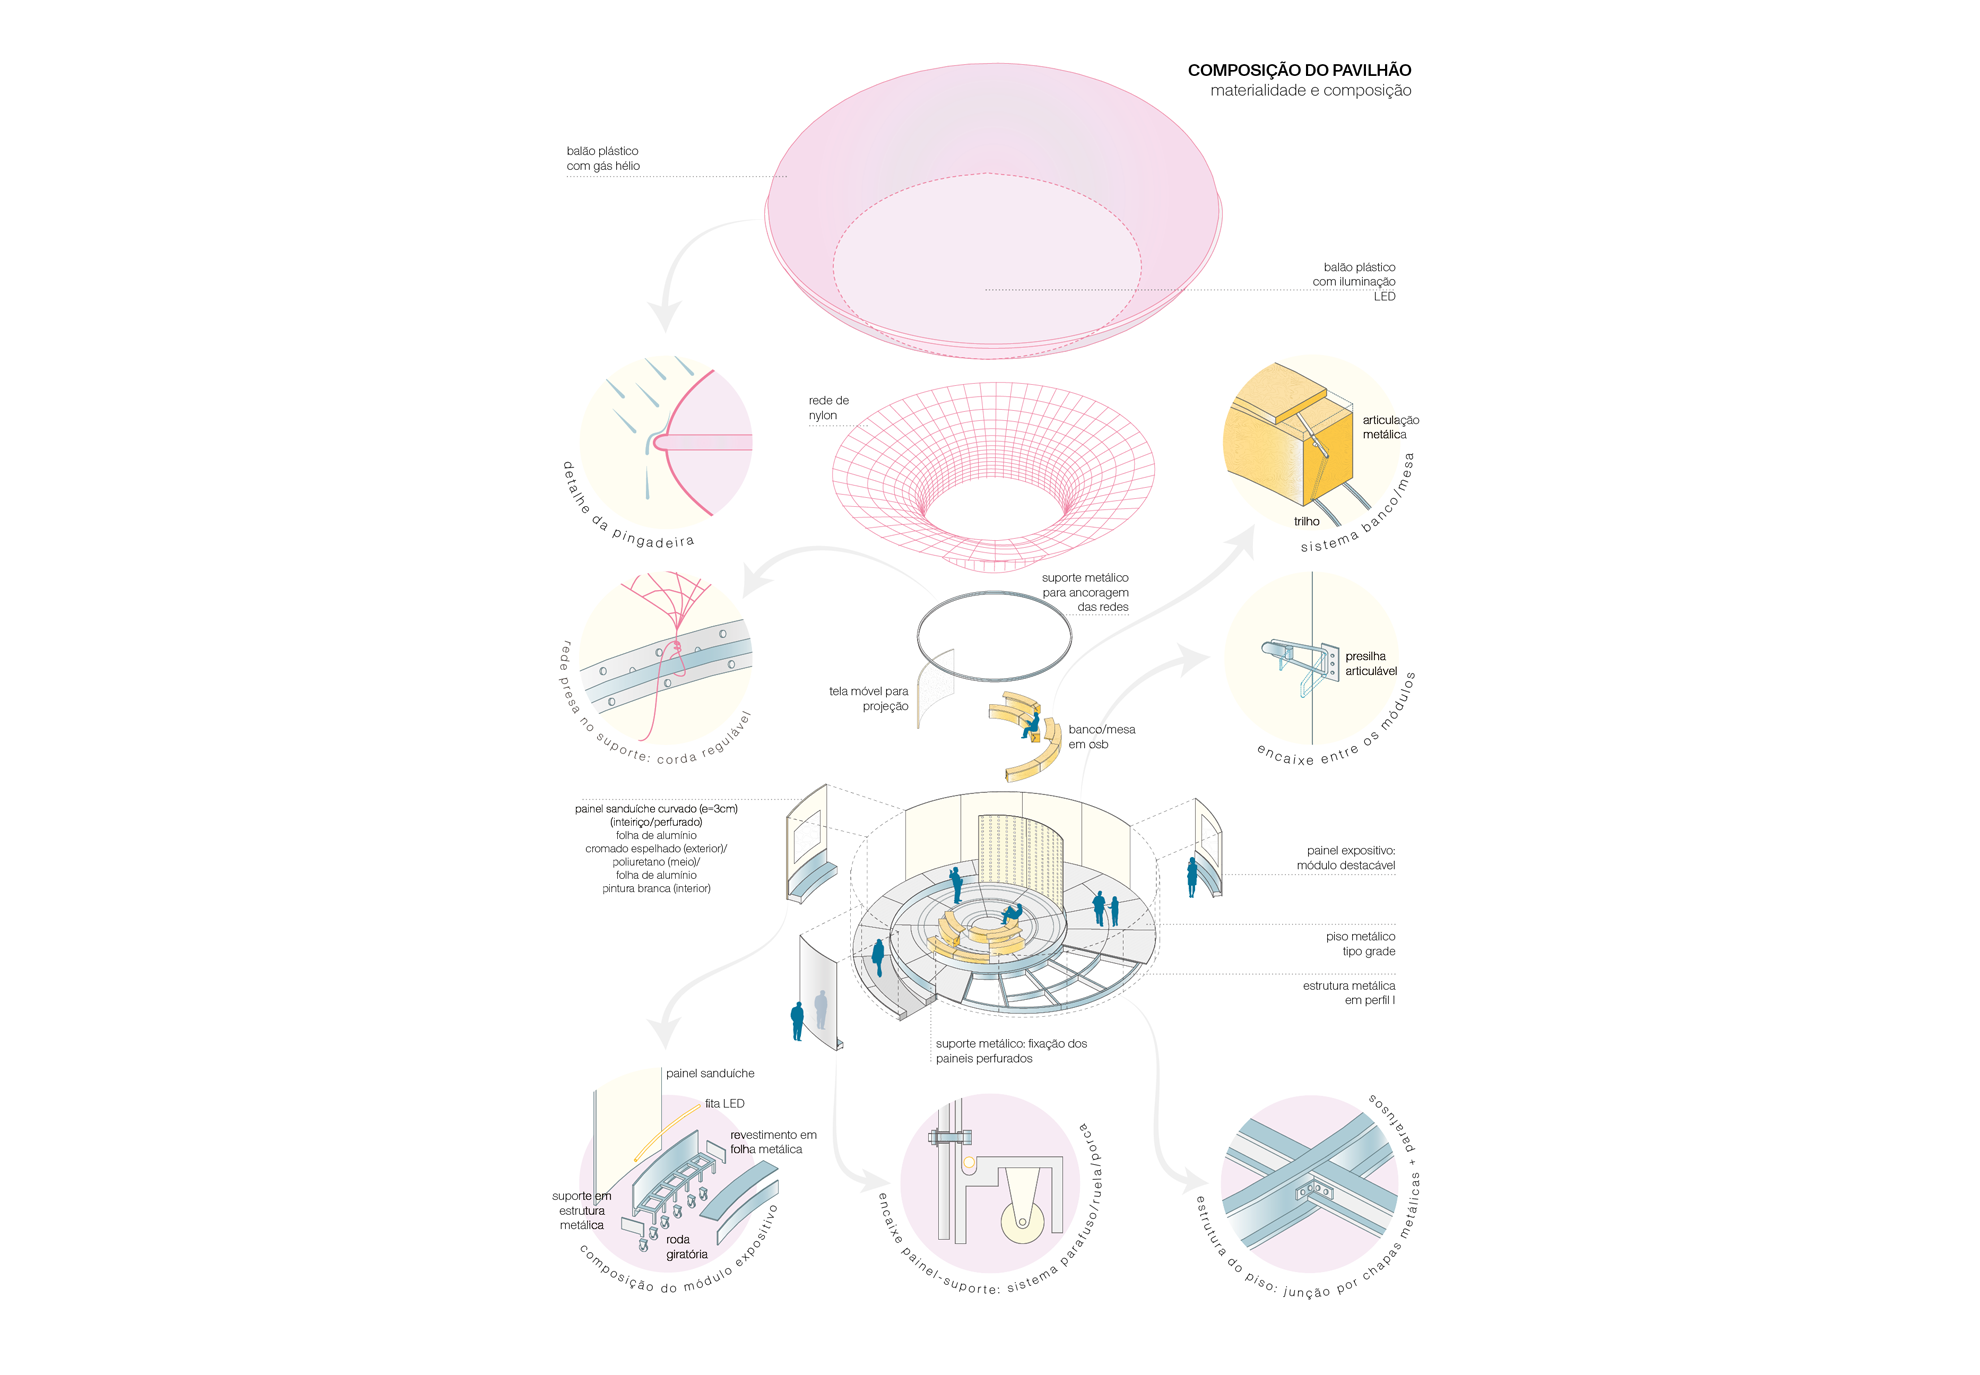
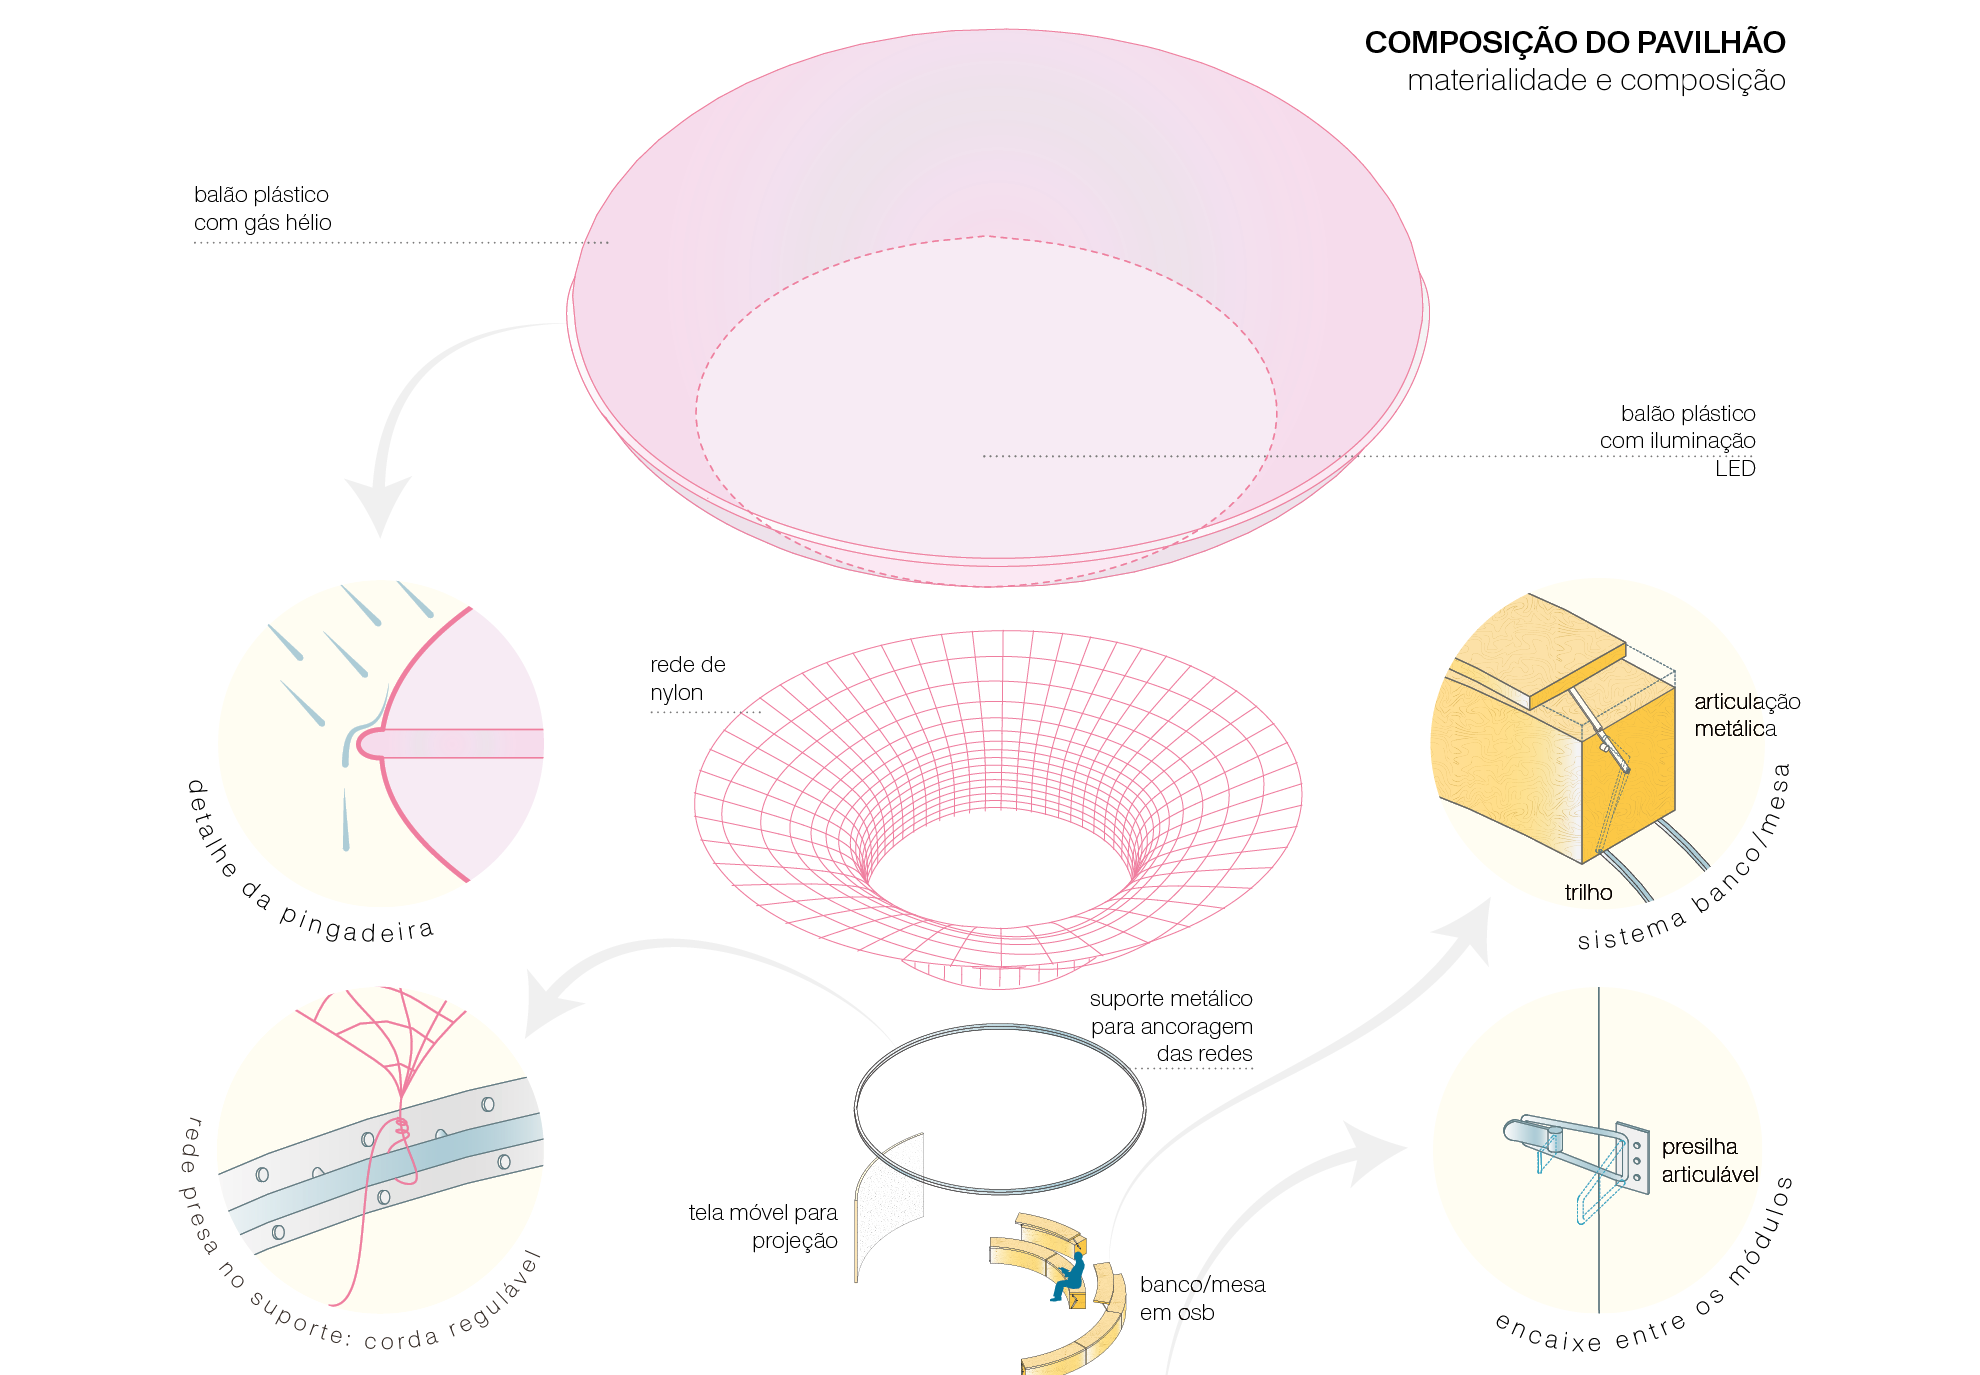
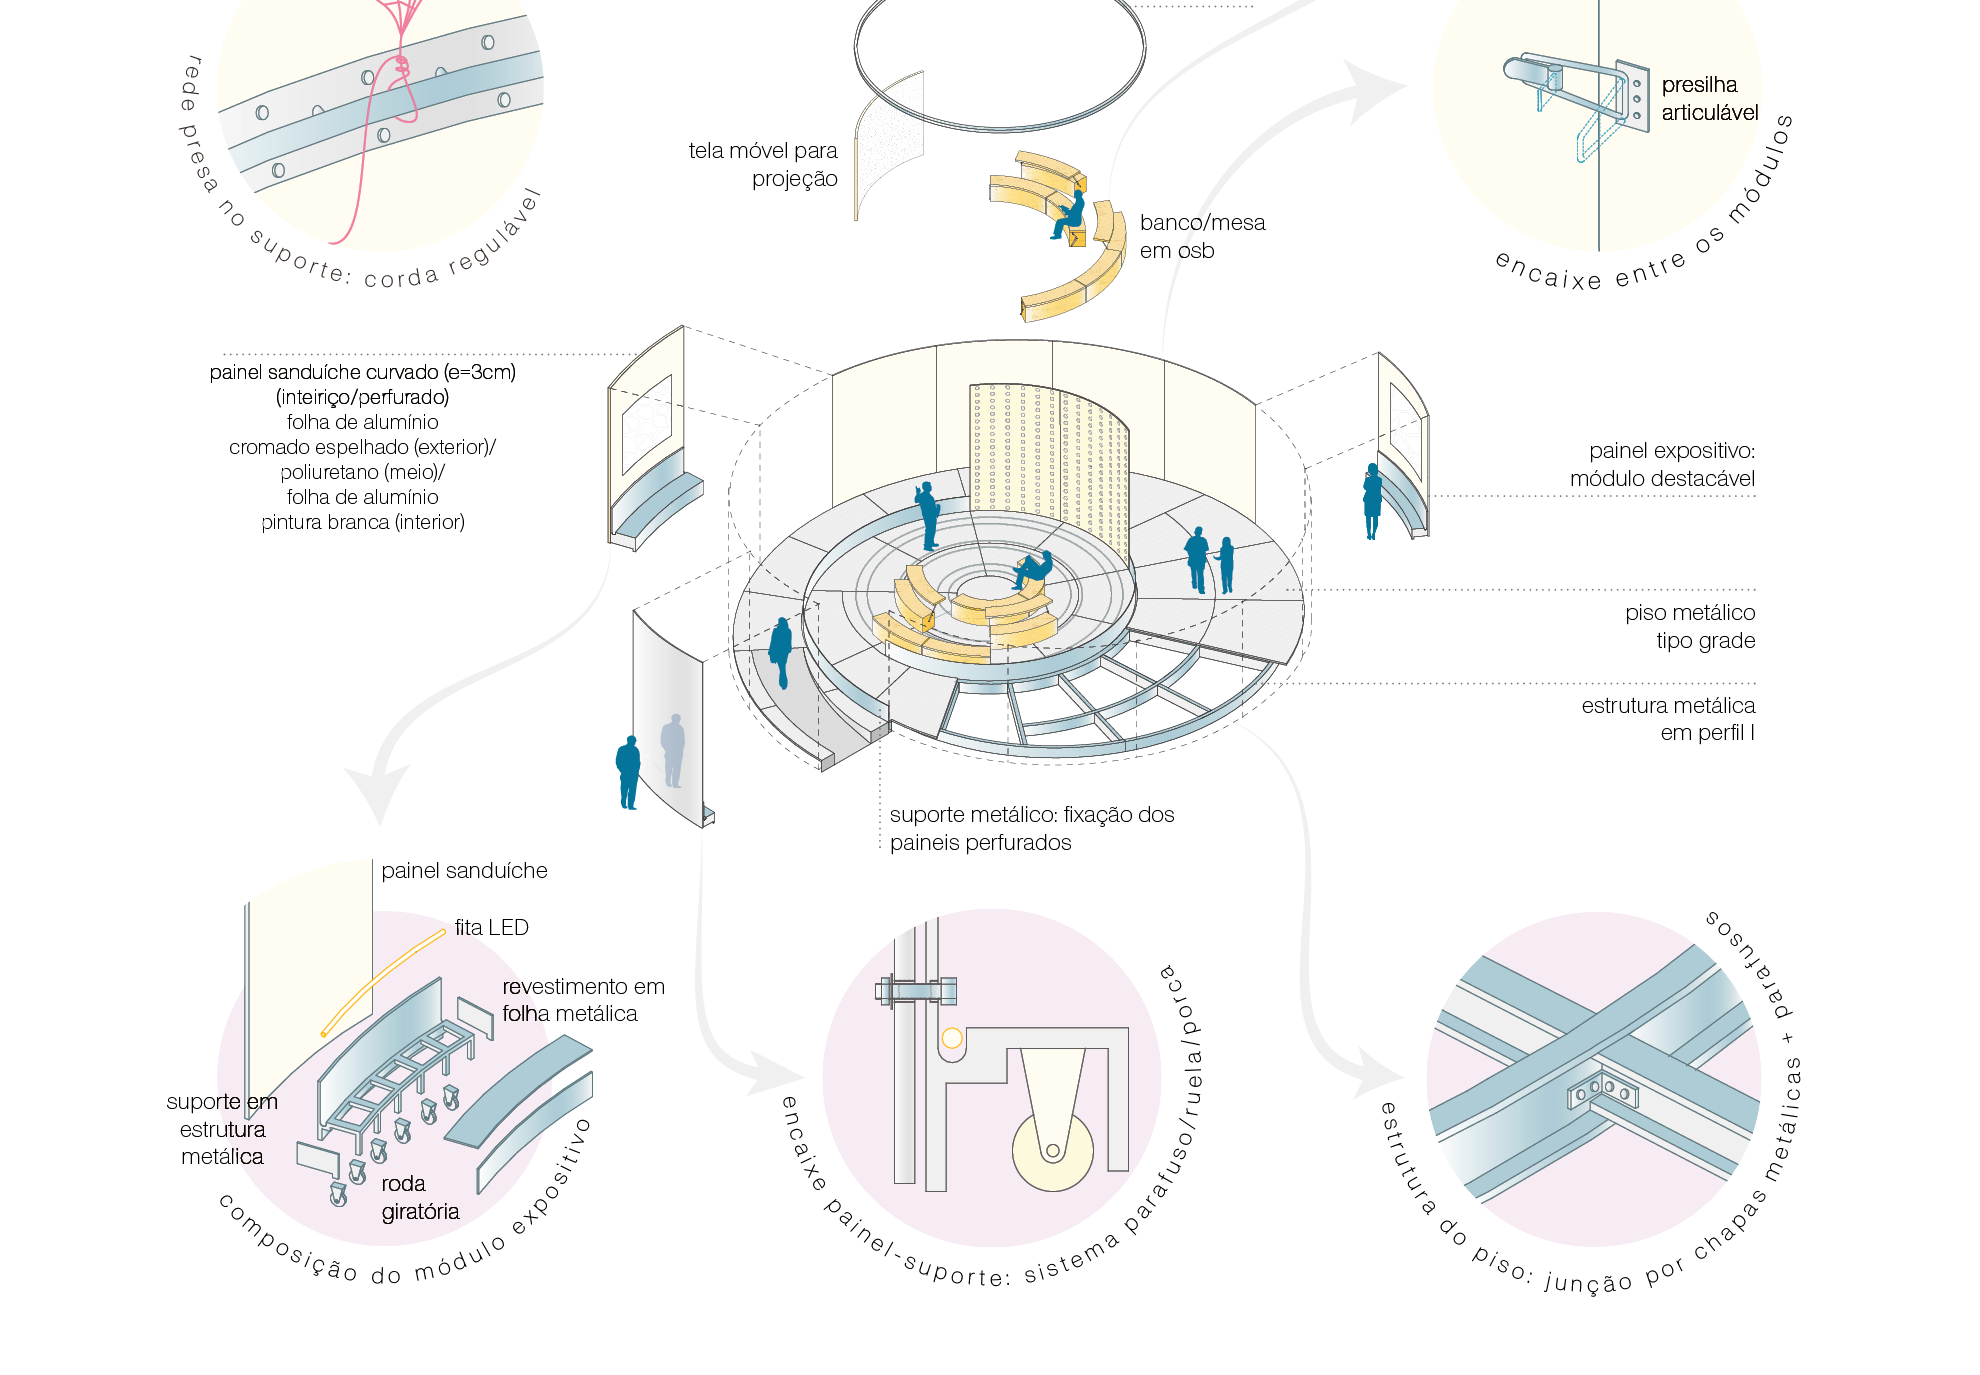
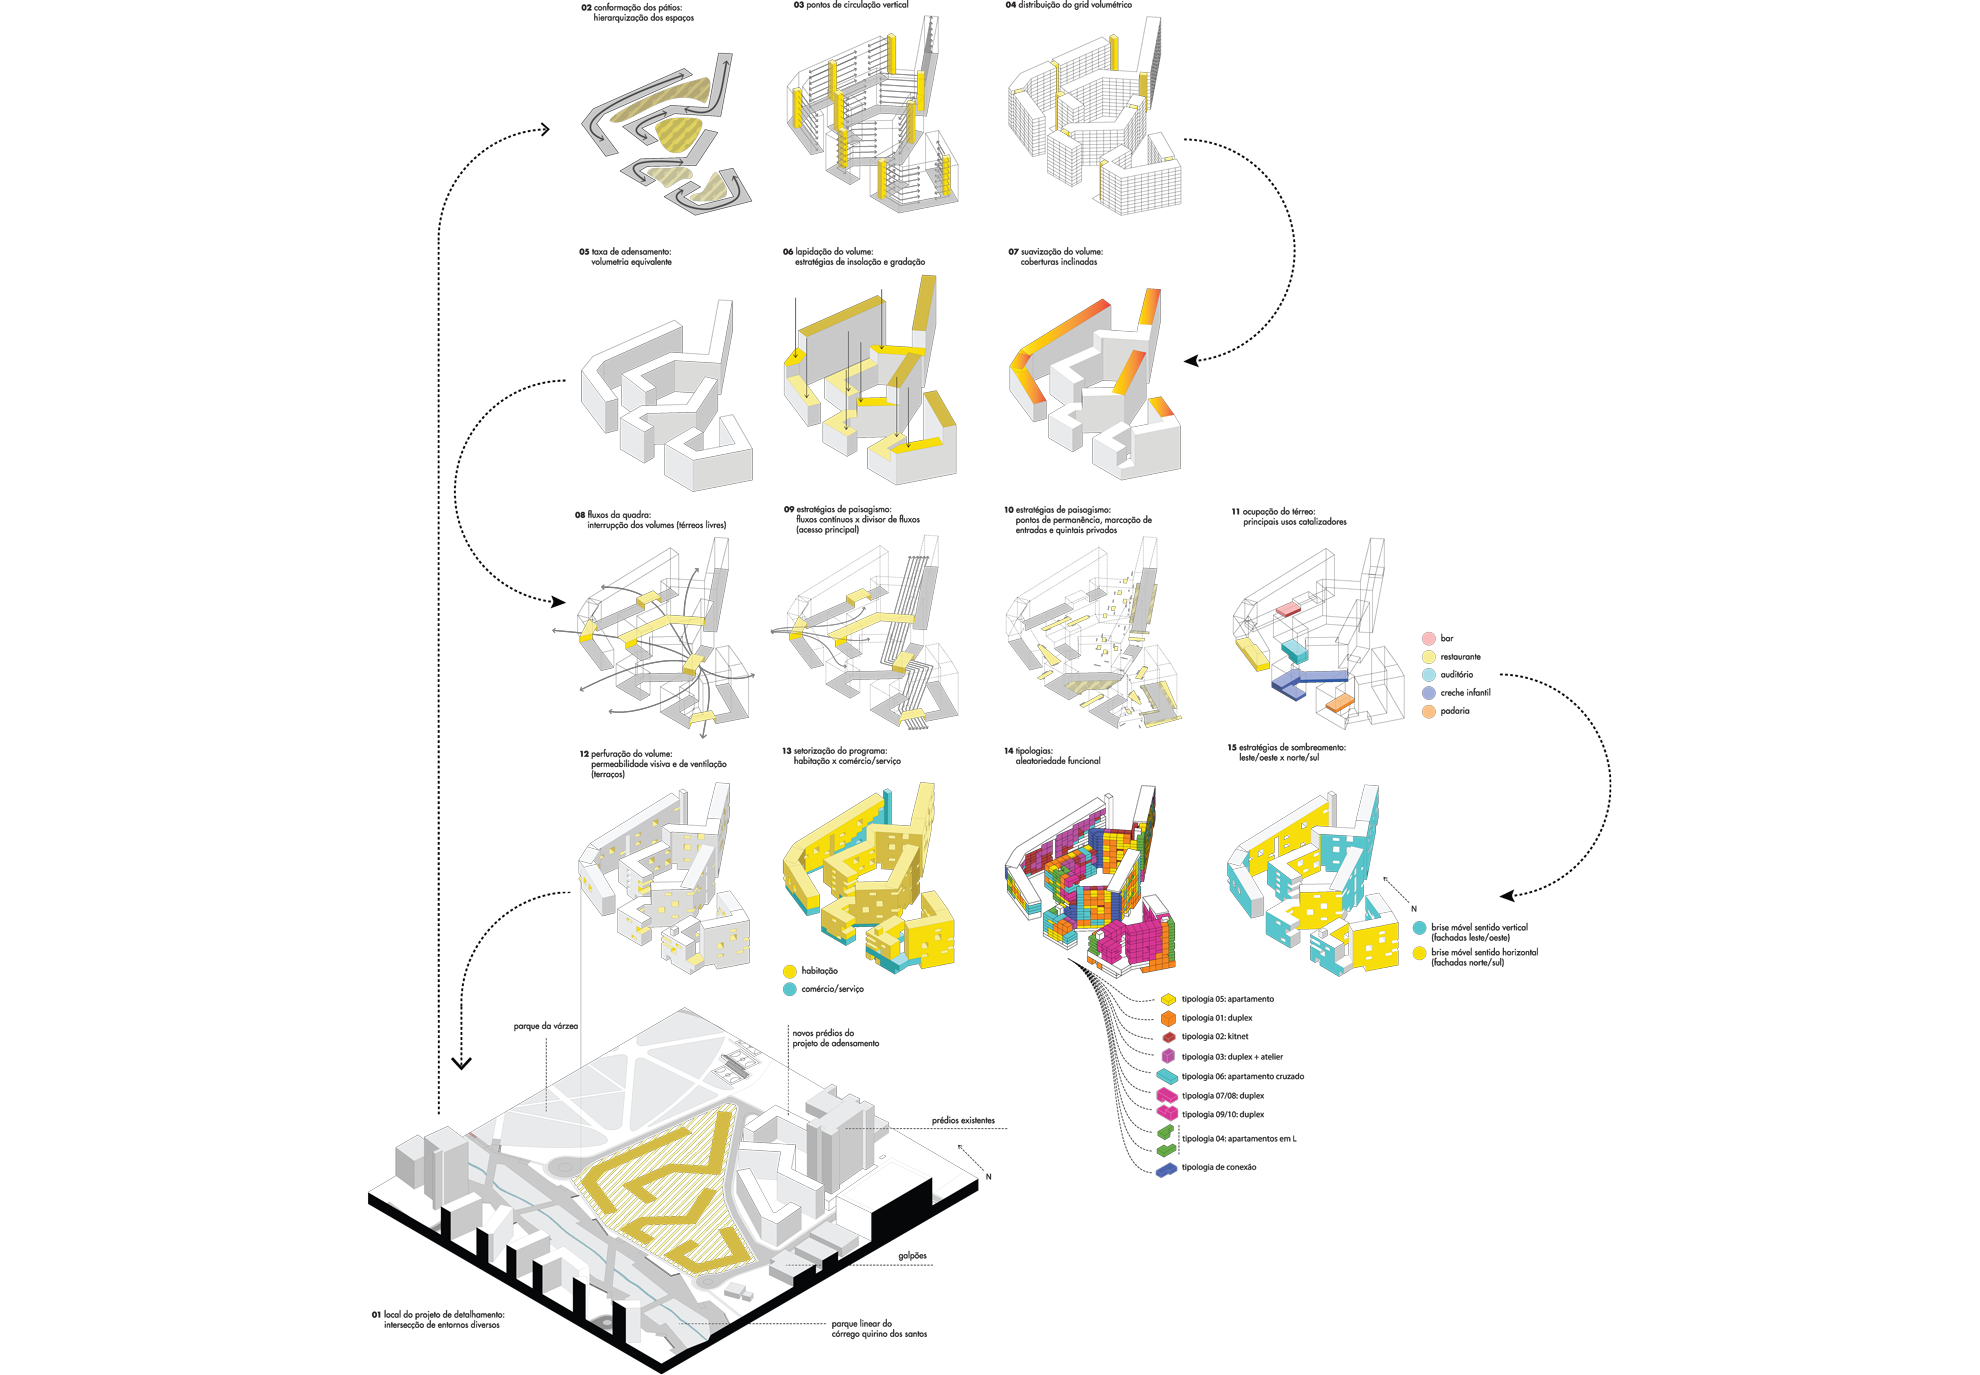
This compilation of 3D images brings together diagrams that represent architectural projects developed during college and for idea competitions. These representations illustrate from technical solutions (construction details, fittings, structure, materials, accessibility, natural lighting and ventilation) to conceptual aspects of the projects (volumetry, sectorization, spatial organization).
︎︎︎
